Spectrum Filter |
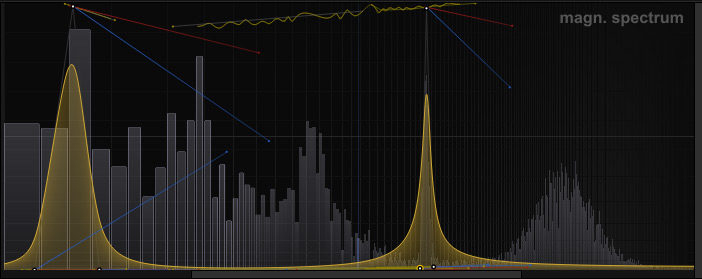
OverviewThe Spectrum Filter is the spectral-filtering and spectral-additive synthesis unit of Cycle. It also gives control of the phase spectral domain which can be used to great effect in natural sounds. Like the Time Surface, this component has two editors that show different perspectives of the spectral information. The spectrogram view is a topographical perspective showing the spectrum's evolution over time (or another morphing range). The 2D spectrum view showing the sound's harmonic spectrum at a particular moment in time set by the playback bar. There are also two halves of the spectral domain - harmonic magnitudes and harmonic phases. Each of these has an independent set of layers. |
Magnitude Spectrogram Editor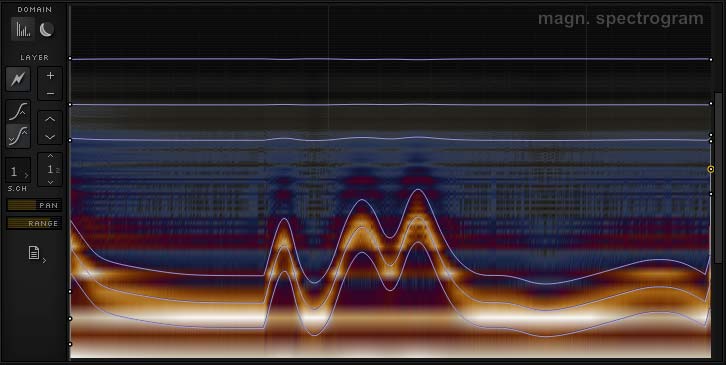
This area shows the spectrum of the sound as it evolves over a morphing range. The visualization is like a topographic map of the changing spectrum. Different magnitude levels are distinguished between visually by the colouring scheme: black = low, blue = medium low, magenta = medium, orange = medium high, white = high. The lines in this editor are the vertex paths distorted by a scratch envelope. |
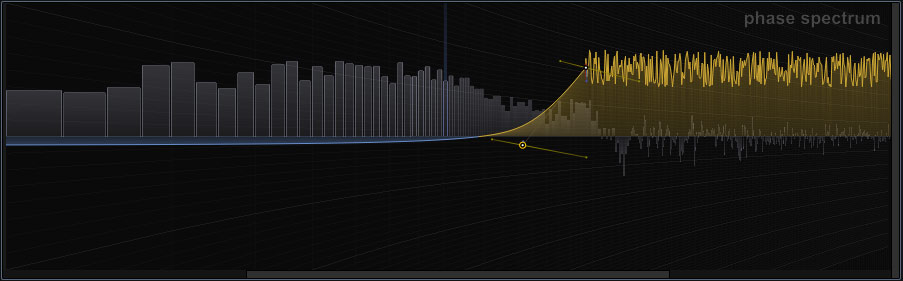
Phase Spectrogram Editor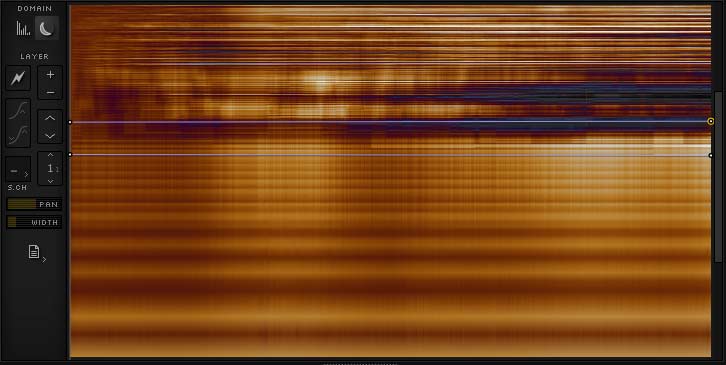
In this view you can see the unwrapped phases of the cycles of our sound across a morphing range. Harmonic phases are values between 0 and 2π. Phase unwrapping means that from one cycle to the next, if the phase jumps from the highest value to a low value we can be confident it's drifted higher and wrapped rather than jumping down. If we correct for this, we get a smooth pattern out of the chaos that looks like the above visual. With this visualization, we can see if certain harmonics drift one way or another. This is particularly obvious in plucked instrument samples samples when they are analysed. |
Layer Controls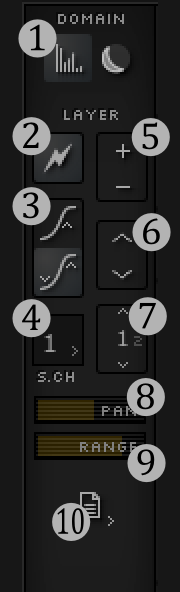
|