Time Surface |
OverviewThe Time Surface is the name we use for the time-domain synthesis unit in Cycle. It's a multilayered shape-morphing oscillator. There are two windows that visualize different perspectives of the Time Surface. One is called the Waveform Surface and shows the entire signal from start to end. The other is the Waveshape Editor and shows a single cycle at a particular time (the time set by the playhead of the playback bar. On this page: |
Waveform Surface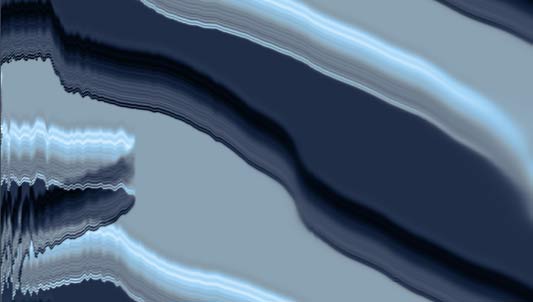
This area is another view of the same curve wireframe and signal you see in the waveshape editor. It shows what the waveform looks like if you arrange the cycles of the signal into columns and look down from above, like a topographical map. In this way you can see how the waveshape evolves. See the exact visualization process here. 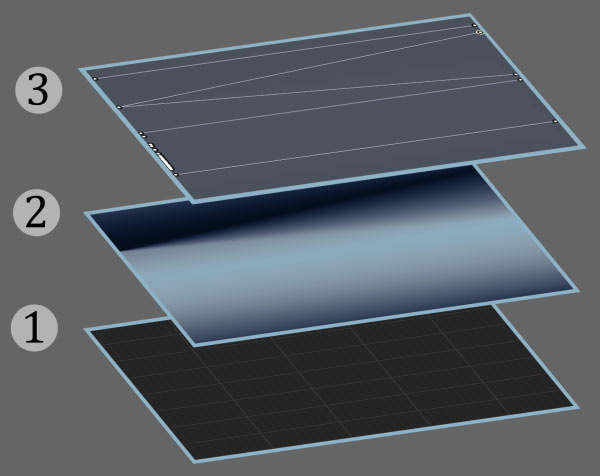
1. Background |
Waveform Surface Visualization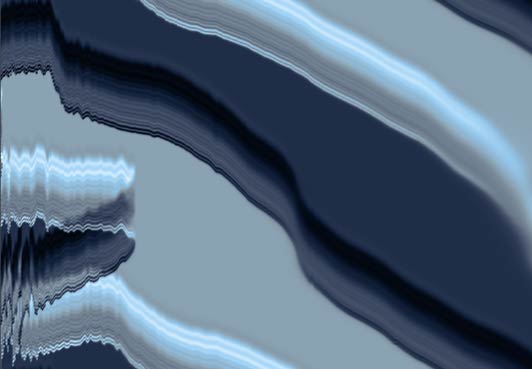
This is how the signal is represented in the waveform surface. Cycles are juxtaposed in columns as if you were looking down from above. This perspective shows all of the signal's data from beginning to end of the currently viewed morphing range. Light colours corresponds to positive parts of the waveform while dark colour corresponds to the negative parts i.e. a trough. 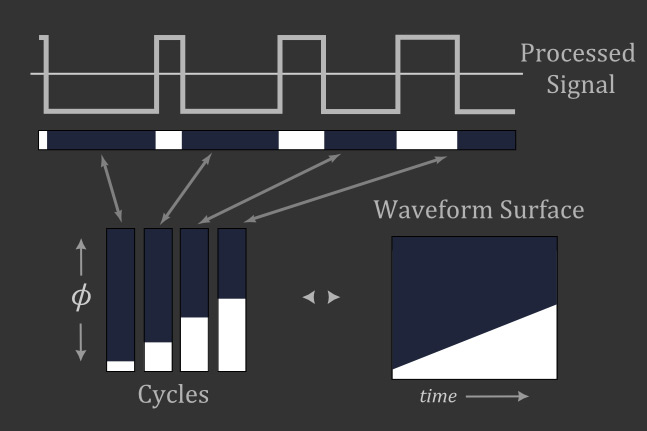
|
Waveshape Editor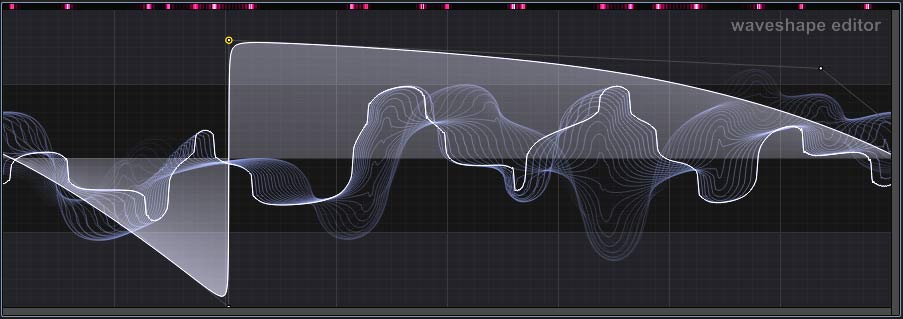
This area is where the oscillator's waveshapes are created. Only one layer's waveshape curve is visible and editable at a time. 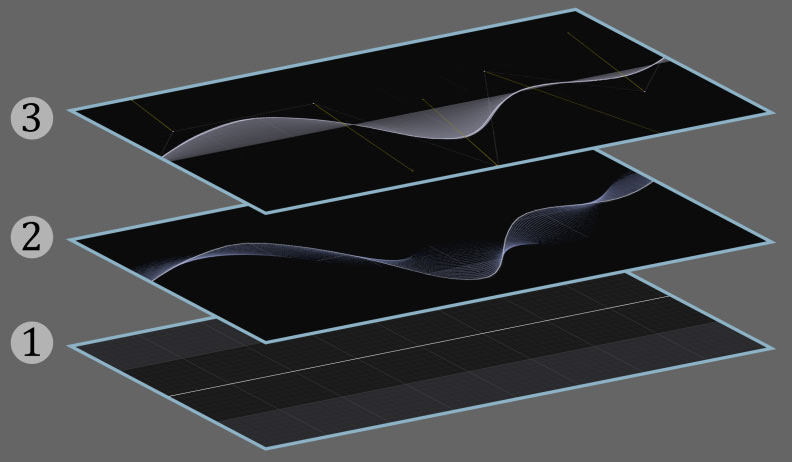
1. Background |
Waveshape Editor VisualizationThis is how the signal is represented in the waveshape editor. The future cycles of the processed signal are shown receding into the depth of the screen. The purpose is to see what effect the various processing stages of Cycle have on the signal and also how the signal's waveshape changes with time. By changing the view depth (on the Playback Bar, the time range of the signal shown is adjusted. Often when the signal is too 'busy' you might want to reduce the view depth. 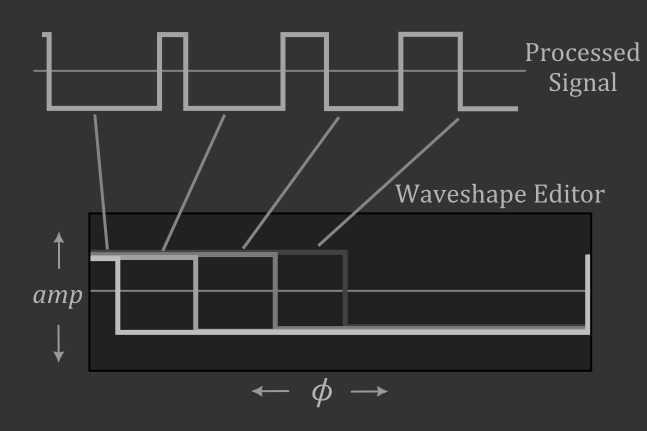
|
Layer Controls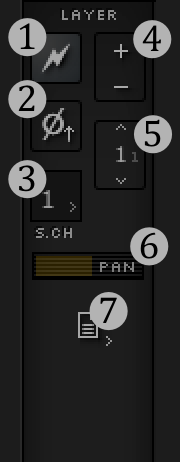
|